On Thursday, November 18, 2021, the International Brotherhood of Teamsters (IBT) announced that Sean O’Brien had been elected as the new general president of the union, following more than twenty years of rule by James P. Hoffa. O’Brien, running mate Fred Zuckerman, and their entire “Teamsters United” slate swept the election, winning every seat on the union’s General Executive Board (three seats for the union’s Canadian region went to the uncontested “Team Canada” slate). O’Brien-Zuckerman (OZ) Teamsters United decisively defeated the Hoffa-backed Teamster Power slate, led by Steve Vairma, two-to-one.
For many, that said it all: the good guys won. “There are landslide elections, and then there are LANDSLIDE elections. The Teamsters just had the italicized all-caps version,” wrote Harold Myerson of the American Prospect. Teamsters for a Democratic Union (TDU) posited, “It was a landslide because Vairma’s more-of-the-same message didn’t attract members, even in their own locals. And most of their candidates don’t have a clue about how to involve members; in fact, they prefer passive members.” Labor Notes hailed the victory, “It’s the first time in almost a quarter-century that a coalition backed by Teamsters for a Democratic Union has taken the driver’s seat in the international union.”
The Teamsters are unique among North American unions as one of the only unions that elects top leadership by direct membership ballots—most unions use a delegated convention. As a result of imposed federal “consent decree” in 1989, Teamster elections are monitored by the Office of the Election Supervisor (OES), which certifies election results, adjudicates election violation allegations, and delivers executive reports that can be inspected at the membership (through the website www.ibtvote.org ). The ballot data, along with the union’s reports and filings, allow us to get a deeper look at what happened in the election, and more broadly get a “state of the union”.
The membership
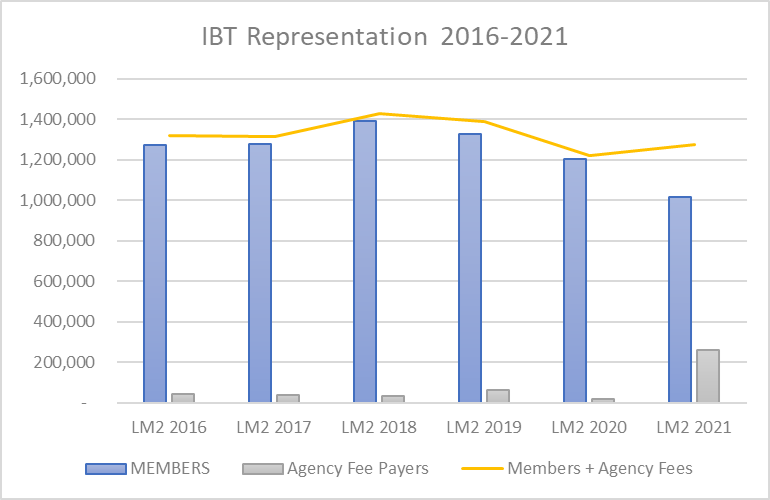
The IBT’s LM-2 filings with the federal government over the five years between the two elections give some sense of the dynamics in the union. Outgoing president James Hoffa left the union with a serious crisis that the new leadership has to address. According to the Teamsters’ own reported figures, it lost more than one quarter of a million members since the last election – 1 in 5 union members have disappeared. Where did they go?


Undoubtedly, the COVID-19 pandemic affected the Teamsters, as it did all labor unions, with the temporary closure of non-essential industry and slowdown of the economy generally. Most of this loss, however, appears to be after the re-opening of the economy. The total number of workers represented went up between 2020 and 2021, but what appears to have happened is that a staggering number of workers have moved from union membership to paying agency fees only. On average, the proportion of agency fee payers to members in the IBT has been 3% — in 2021, it jumped to 20%.

This shift cannot be explained by the 2018 AFSCME vs. Janus ruling, introducing right-to-work provisions into the public sector, because that ruling absolved represented workers of the obligation to pay agency fees. For the IBT, the new agency fee payers can only be located in the private sector, in one of the twenty-two union security states, grouped in the northeast, Illinois/Minnesota/Missouri, and the West Coast. The figures also say nothing about how many “free riders” (entitled to Union benefits while not paying dues or fees) are represented in right-to-work states and, now, the public sector.
The Election
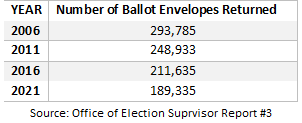
Looking just at the 2021 election, the OES Report to IBT #3 states, “OES sent ballot packages to 1,391,225 ballot-eligible IBT members.” Of that, 189,335 ballots were returned (13.6%). The report’s own table shows this to be the lowest figure to date:

22,300 fewer ballots were returned (a 10.5% drop from 2016). Of the returned ballots, a number are always disqualified and so the final ballot tally was 173,556. O’Brien received 115,573 votes to Vairma’s 57,983. Turnout has dropped in every Teamster election since the right to vote was established in 1991 – only Ron Carey’s re-election campaign in 1996 boosted turnout.
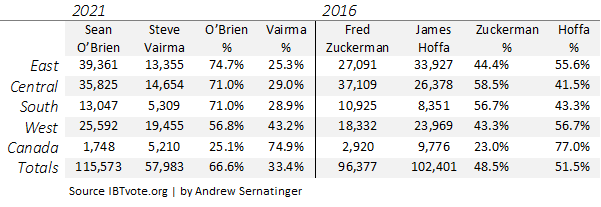
Looking at the union’s regions, this tells us more about what is happening in the race beyond a flat 2-1 victory. Overall, we see that Teamsters United won every district, save for Canada, which has traditionally been allied to Hoffa in exchange for autonomy. By comparison, in 2016 Teamsters United won only the Central and Southern districts.


In this election, turnout was down almost everywhere. Teamsters Canada’s votes were cut in half – a drop of nearly 6,000 votes. O’Brien’s Eastern region turnout was down 15%, roughly following the trend of the union’s membership loss over the 2016-2021 period (see above). The Central region, a key battleground, had 20% lower turnout – OZ Teamsters United’s votes were more or less flat, but Teamster Power’s voters didn’t show up. Only Vairma’s Western region turnout grew, increasing turnout by 6%.
OZ’s decisive victory looks different in this light. Turnout fell in nearly every Teamster local. Local turnout was typically up only in candidates’ own locals – and sometimes not even then. In Chicago, Juan Campos’ Local 705 turned out 5,400 members to vote, an increase of 2,000 from 2016, and allied Locals 743 and 786 about doubled their votes; Tom Erickson’s Local 120 in Minnesota likewise increased its turnout 66%, another 800 votes; Danny Avelyn’s Local 554 in Omaha, NE was up and so on. Interestingly, Fred Zuckerman’s Local 89’s turnout declined by about 1,000 votes in 2021 – almost all from those who had voted Teamsters United five years earlier.
The regional votes are instructive for explaining what happened: the Hoffa coalition split, with an Eastern-based O’Brien taking his side to Teamsters United and Vairma continuing the Hoffa administration as Teamster Power. That divide had local leaders behind O’Brien take thousands of 2016’s Hoffa voters over to OZ Teamsters United in 2021 – the new leadership has a lot of old faces. O’Brien’s Local 25 shifted nearly all its 2,154 votes for Hoffa last election towards Teamsters United this time around. In the rest of the country, the Teamsters United vote was flat or fell, boosted mainly by candidates’ locals or district councils.
Vairma’s half of the Hoffa coalition largely decided not to mobilize their vote. For example, Local 175, home of Hoffa’s right-hand Ken Hall, saw turnout fall by 72%—only 206 votes in 2021 compared to 861 in 2016. The Hoffa share of that vote dropped from 717 to 35! Teamster Power’s numbers, when viewed at the local level, suggests not that they were unable to muster support, but on the whole they either chose not to campaign or switched sides to O’Brien. Only in Vairma & Herrera’s home Western region did Teamster Power put up a fight, and there, while they were still defeated, the vote results were more respectable: 57% to 43%.
What we don’t know
As much as we can describe what happened with the votes, there’s surprisingly little we can say about the voters. There is no polling in union elections. We have only anecdotal evidence about who votes, so we do not have any measurable sense of who votes by employer, industry, race, ethnicity, gender, nationality, whether they are first-time voters, and so on.
All we know is how each local voted, and then an aggregate by region. At best we can attempt to match up what we know about each of the hundreds of union locals and their collective thousands of employers to make a guess at who turned out and why. Sometimes this is revealing, particularly with locals that are primarily UPS or freight-based, but most IBT locals have scores of small employers in practically every industry in the economy that makes this difficult to decipher.
We also do not know anything about the money. How much money was spent in this election? How much did each candidate raise? Where did they get it from? This information is limited only to candidates in the election for the purposes of ensuring no impropriety took place. Information about donors is private on the grounds that it may contain sensitive information.
Conclusions
At a time when poll after poll shows that young people want unions, and young workers are leading exciting organizing drives at Starbucks and Amazon, how can this translate into enthusiasm in the Teamsters union? Turnout continues to fall in Teamster elections, with only a small fraction of the membership engaged enough to cast a mail-in ballot. However wide a margin of victory, when 86% of the membership don’t turn in a ballot, the leadership’s mandate is left wanting. The Teamsters, like all organized labor, have big tasks ahead and need the enthusiasm of the membership to succeed. This is a problem not solved by election-time campaigning or signing cards but begins to be addressed only by the activity of the union, its presence at the job site, and its posture towards the employers.
Featured Image Credit: Photo by IBTVote.org; modified by Tempest.

